According to Realtor.com, national home prices took the biggest Plunge in 6 years and turbulence in the national real estate market continues… but how are things tracking locally?
After average sales prices steadily climbing to a record high of $350,000 in June, home prices have been decreasing since. From July to August, prices locally dropped ~3% to an average sales price of $340,000. This tracks pretty closely with national trends, where average sales price over that same period decreased from $450,000 to $435,000. So is this a sign that the market is correcting with momentum starting to shift towards a more balance market?
Possibly, but the following stats suggest otherwise:
• During this same period, interest rates have continued to increase at a much higher rate than the rate at which average sales prices are decreasing
• Inventory remains historically low, ending last month at a meager 1.25 months supply of homes for sale
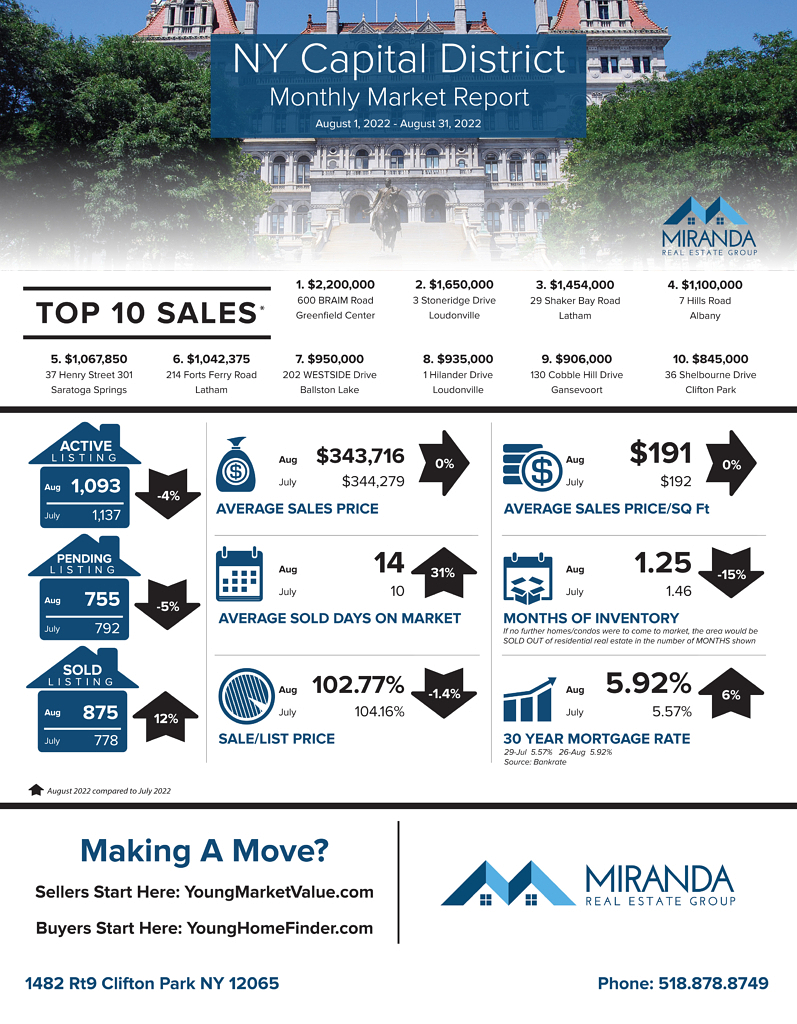
• Volume of homes available for sale is down year over year by 18%, down to 1,093 units for sale and down 4% Month over Month
• BUT pending sales decreased by 20% over that same period, and both median and average days on market has been increasing which could suggest the market is starting a slow crawl towards balance
In summary, signs may be pointing to a more balanced market but at the current trajectory we will be well into next year before reaching any semblance of a balanced market—one with a 4-6 month supply of homes for sale That being said, historically this is the time of year when prices typically slow and prices continue to decrease as we approach the end of the year and our market is trending that way.
So if you’re looking to purchase, momentum may be shifting in your favor and if you’re thinking about selling now is the time to maximize your equity as the market starts to cool.
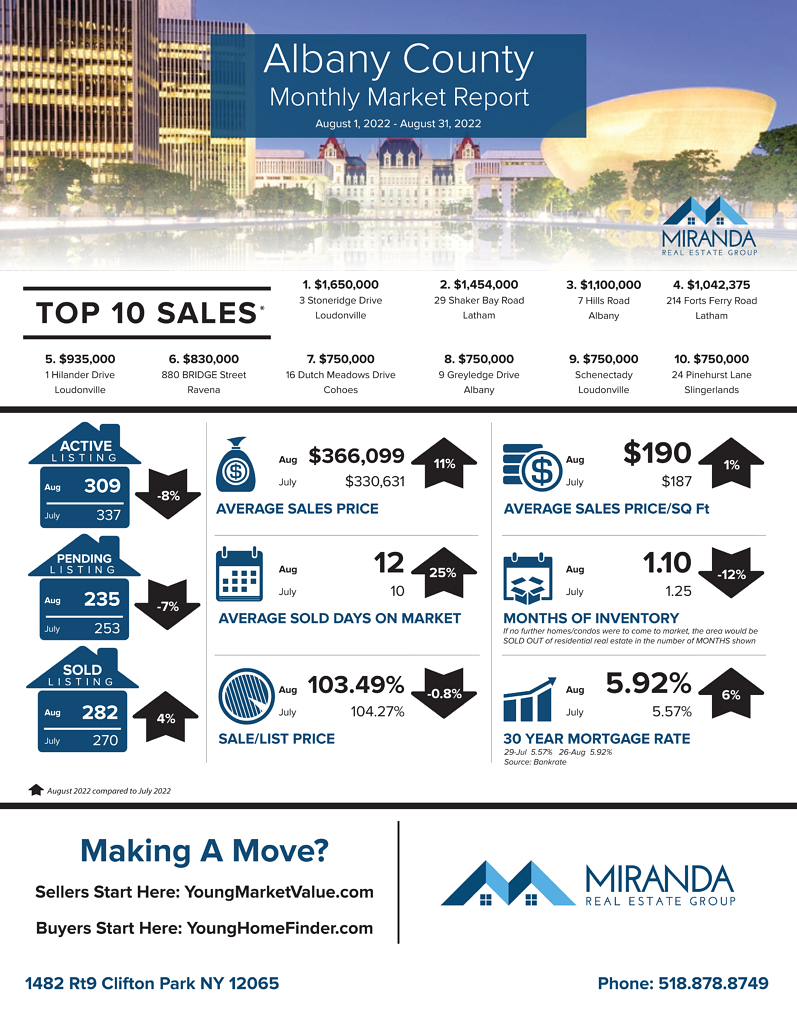
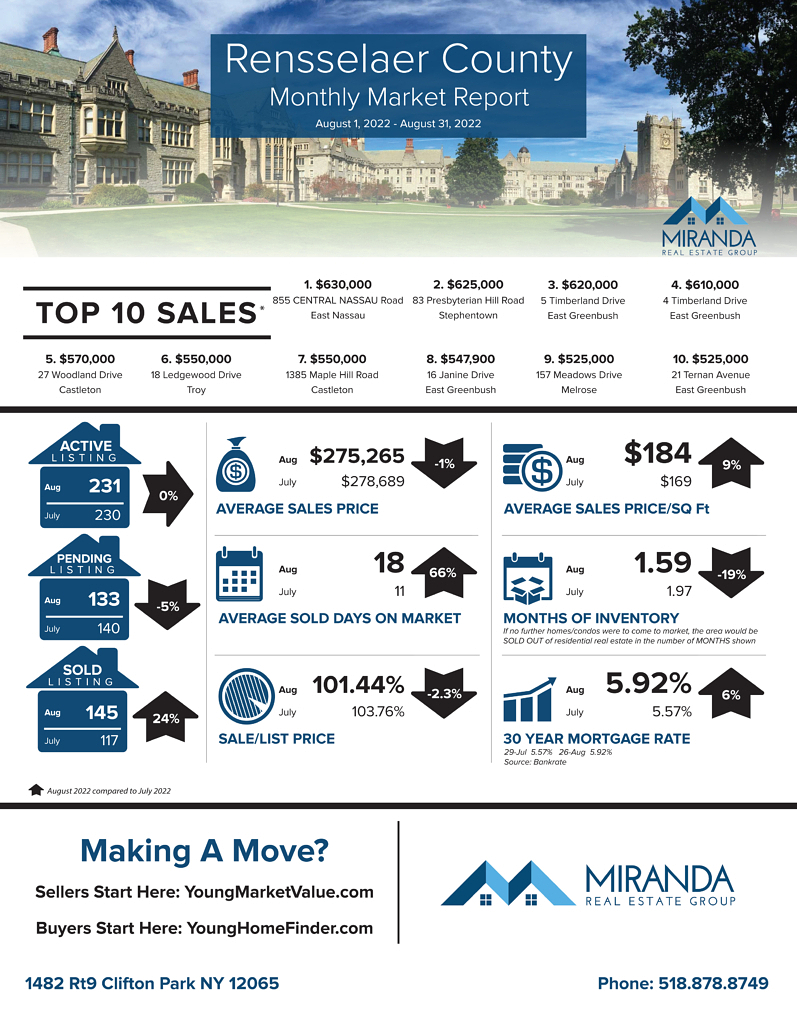
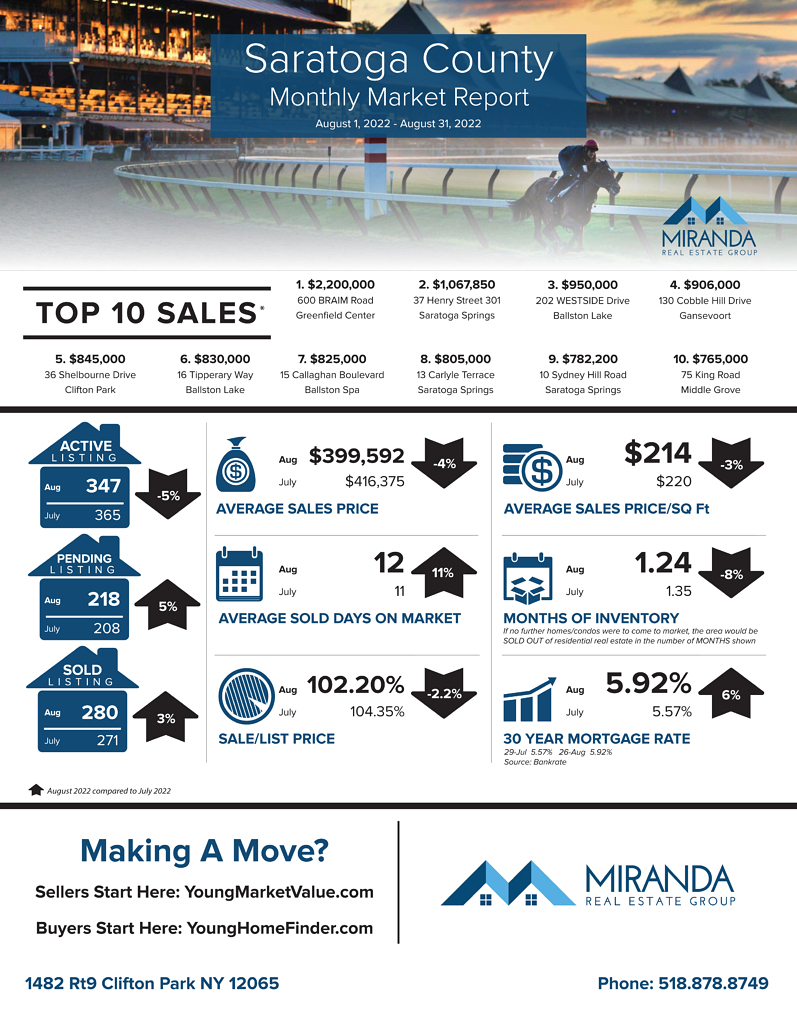
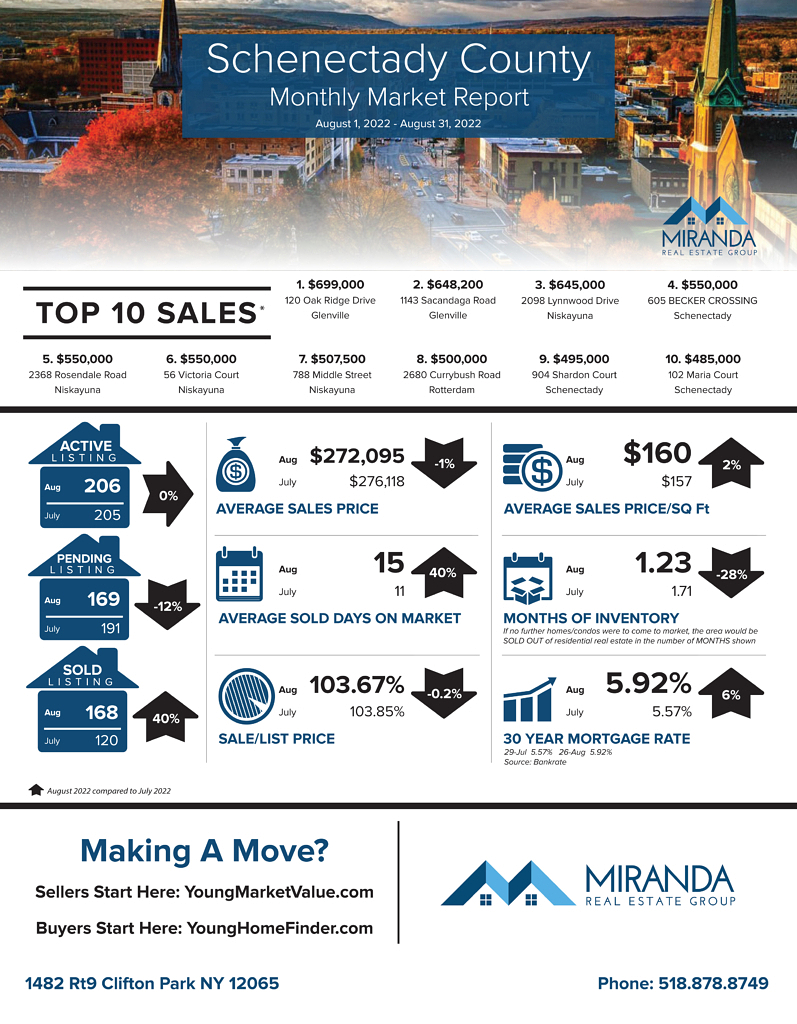
According to data from the Global MLS, the marketplace for NY Capital District residential properties, here are the latest stats:
- The Number of SOLD listings increased by 12% to 875 properties with a top sale of $2.2 million at 600 Braim Rd in Saratoga County.
- The Average Sales Price stayed relatively flat, at $344,000 w/ an Average Price Per Square Foot to $191 per square foot.
- The inventory of properties available for sale as measured in months supply dipped to 1.25 months worth of properties for sale.
- The average 30 year fixed mortgage rate increased to 5.92% according to Bankrate.com.
- Sellers continue to average well above their asking price. Last month, sellers averaged 2.77% OVER ask. This is down nearly 1.5% from last month and down ~2.5% from July close, so another potential sign that the market is starting to cool.