Direct Access To All Multiple Listings Like Realtors®

(Prices and inventory current as of Nov 30, 1999)

See Pictures and updates (icon)See photos and updates from listings directly in your feed

Share with you friends (icon)Share your favorite listings with friends and family

Save your search (icon)Save your search and get new listings directly in your mailbox before everybody else

Direct Access To All Multiple
Listings Like Realtors®

(Prices and inventory current as of Nov 30, 1999)

See Pictures and updates (icon)See photos and updates from listings directly in your feed

Share with you friends (icon)Share your favorite listings with friends and family

Save your search (icon)Save your search and get new listings directly in your mailbox before everybody else

Sign Up

it's quick and easy

We'll never post to social networks

or

  • This field is for validation purposes and should be left unchanged.

Already an account? Log in here

Log in

Please check username or password!

No account yet? Register here

Password forgotten? Reset your password

Reset your password

The email address does not seems to be correct!

Please check your email to reset your password

No account yet? Register here

NY CAPITAL DISTRICT MARKET UPDATE | Q1 ’24 VS Q1 ’23

NY CAPITAL DISTRICT MARKET UPDATE | Q1 ’24 VS Q1 ’23

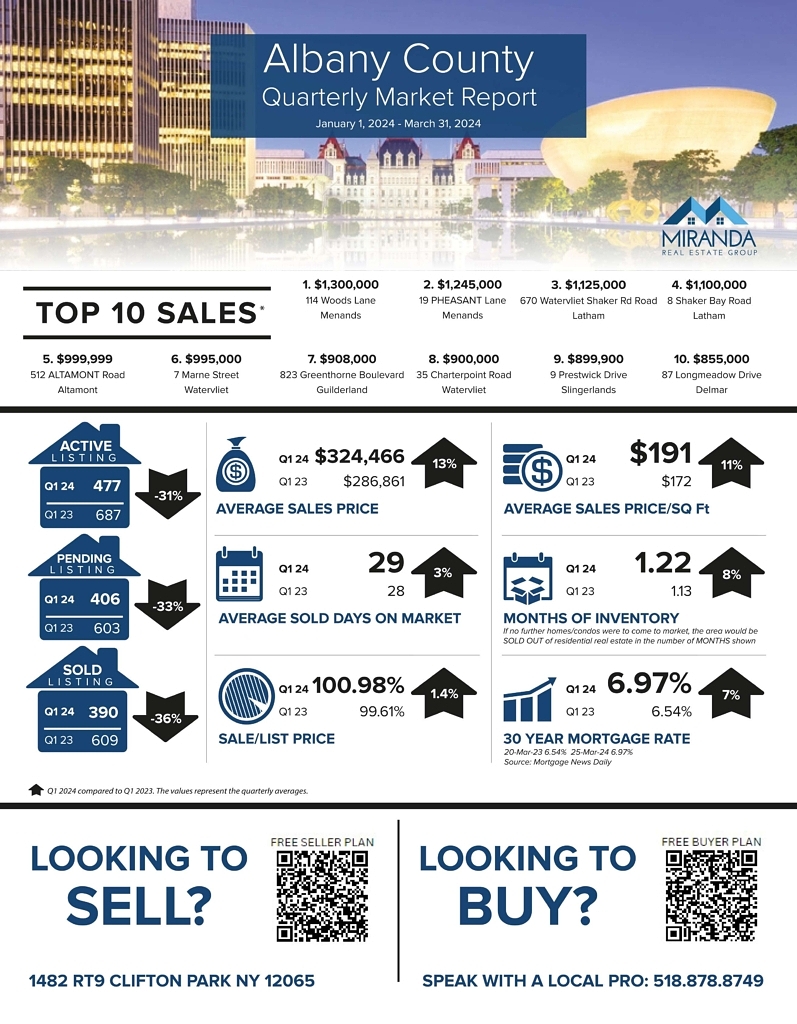
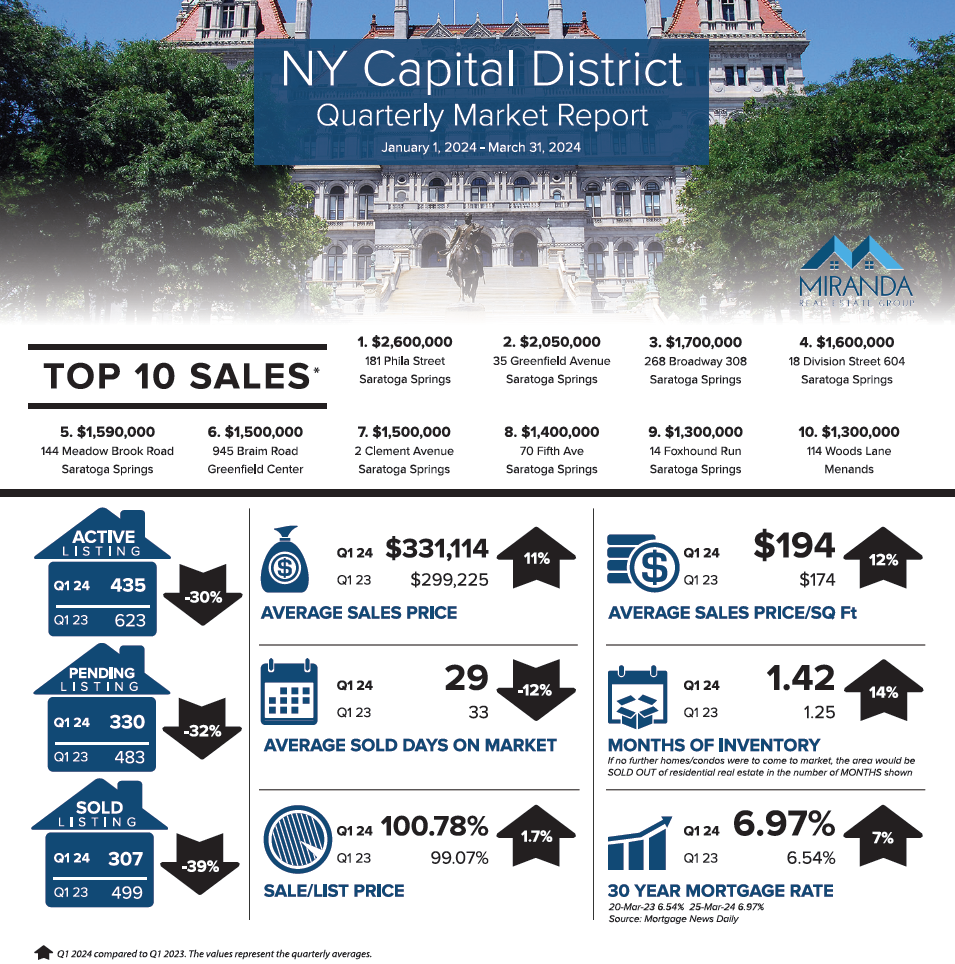
  • Average sales price was up 11%.
  • The inventory of homes available for sale remained relatively flat. Active listings were down 30%, which was offset by fewer closed sales (due to the lack of available inventory).
  • Volume of closed sales was down 39%, and pending sales were down 32%.
  • Interest rates are up ~.5% compared to ’23. 
  • Inventory remains challenging, sitting at a ~1.5 months supply of homes for sale.
    Inventory levels of a 4 – 6 months’ supply is considered balanced, so there is still a long way to go.