If you’re thinking about buying or selling real estate, it’s critical to understand the local market trends.
KEY TAKE-AWAYS:
- Prices up 1% Q2 ’23 vs. Q2 ’22, and up 9% month-over-month
- Our market hit a new 24-month high in June, closing at an average sales price of $364,686. This despite interest rates continuing to hover in the upper-6% range
- Inventory remains challenging with just over a 1 months’ supply of homes available for sale
- Inventory levels of a 4 – 6 months’ supply is considered balanced, so there is still a long way to go.
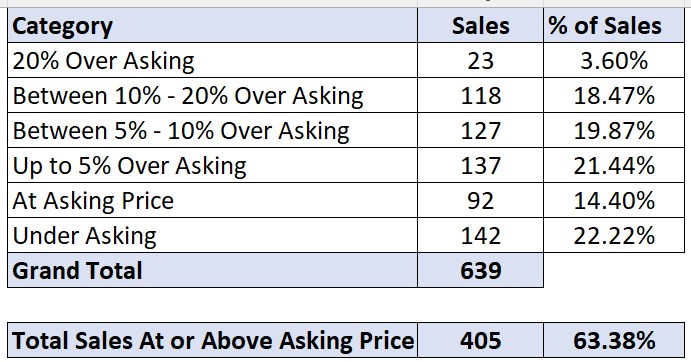
- Sale/List price ratio saw a sizable increase, with sellers averaging 3.99% over their asking price across the 639 closings that we had last month.
- The table below shows the distribution of sales over asking price, with 22% or properties selling 10% or more over asking price and 63% selling at or above asking price.
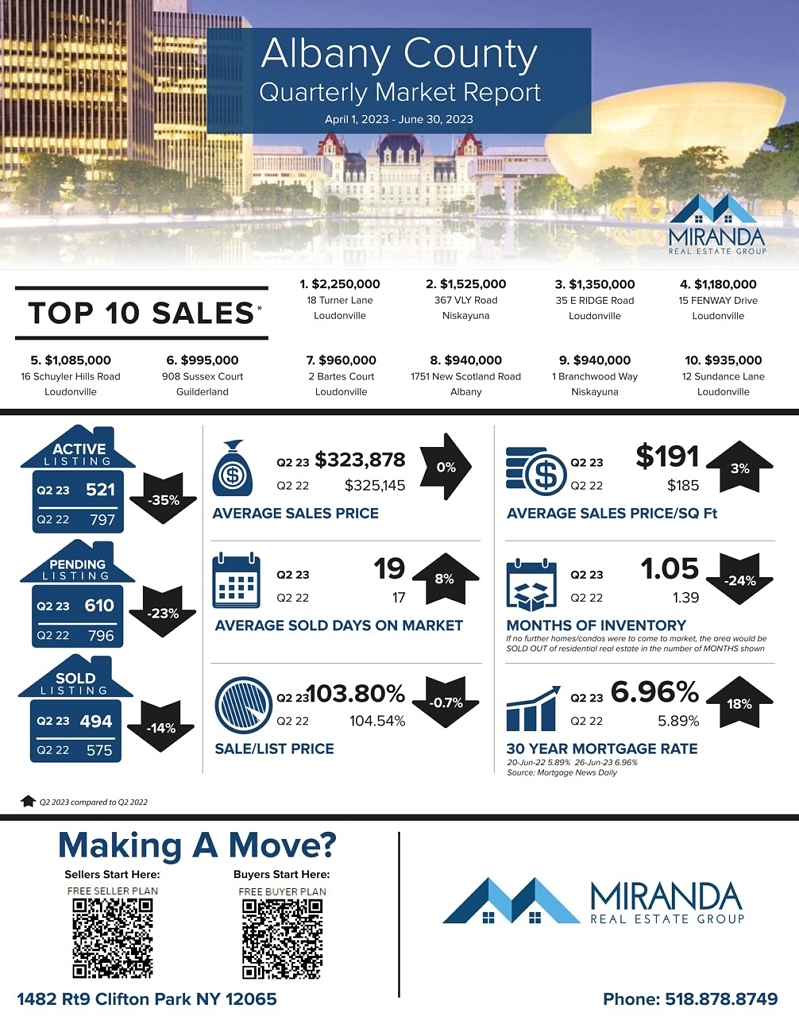
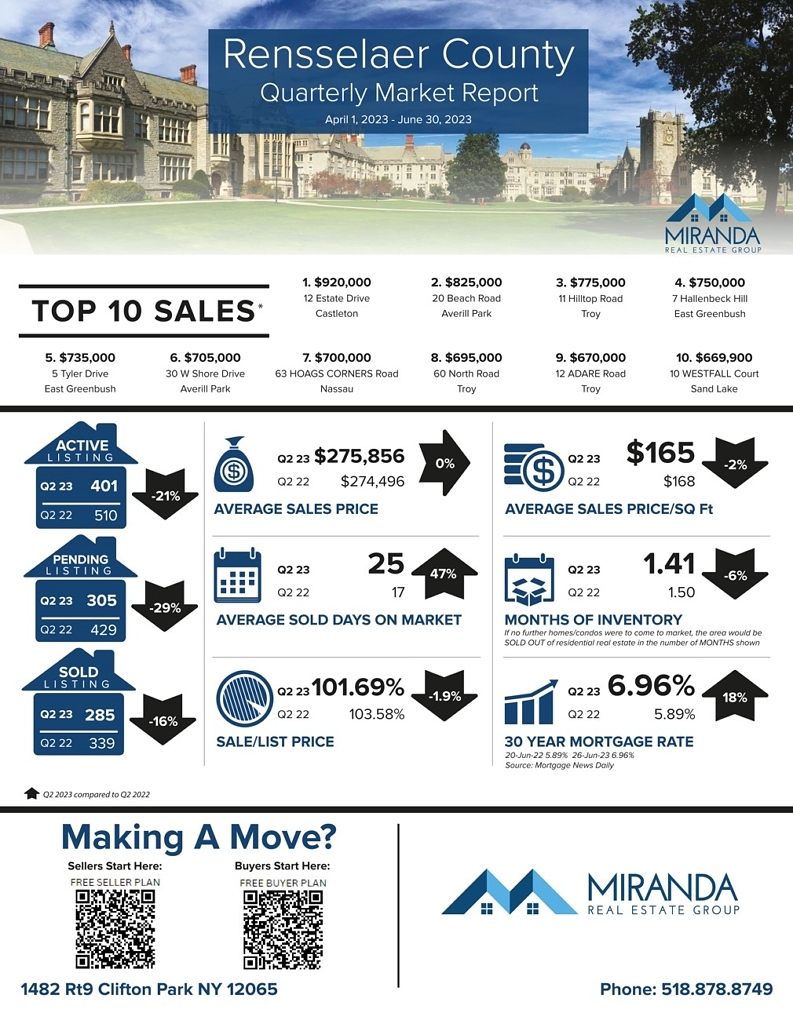
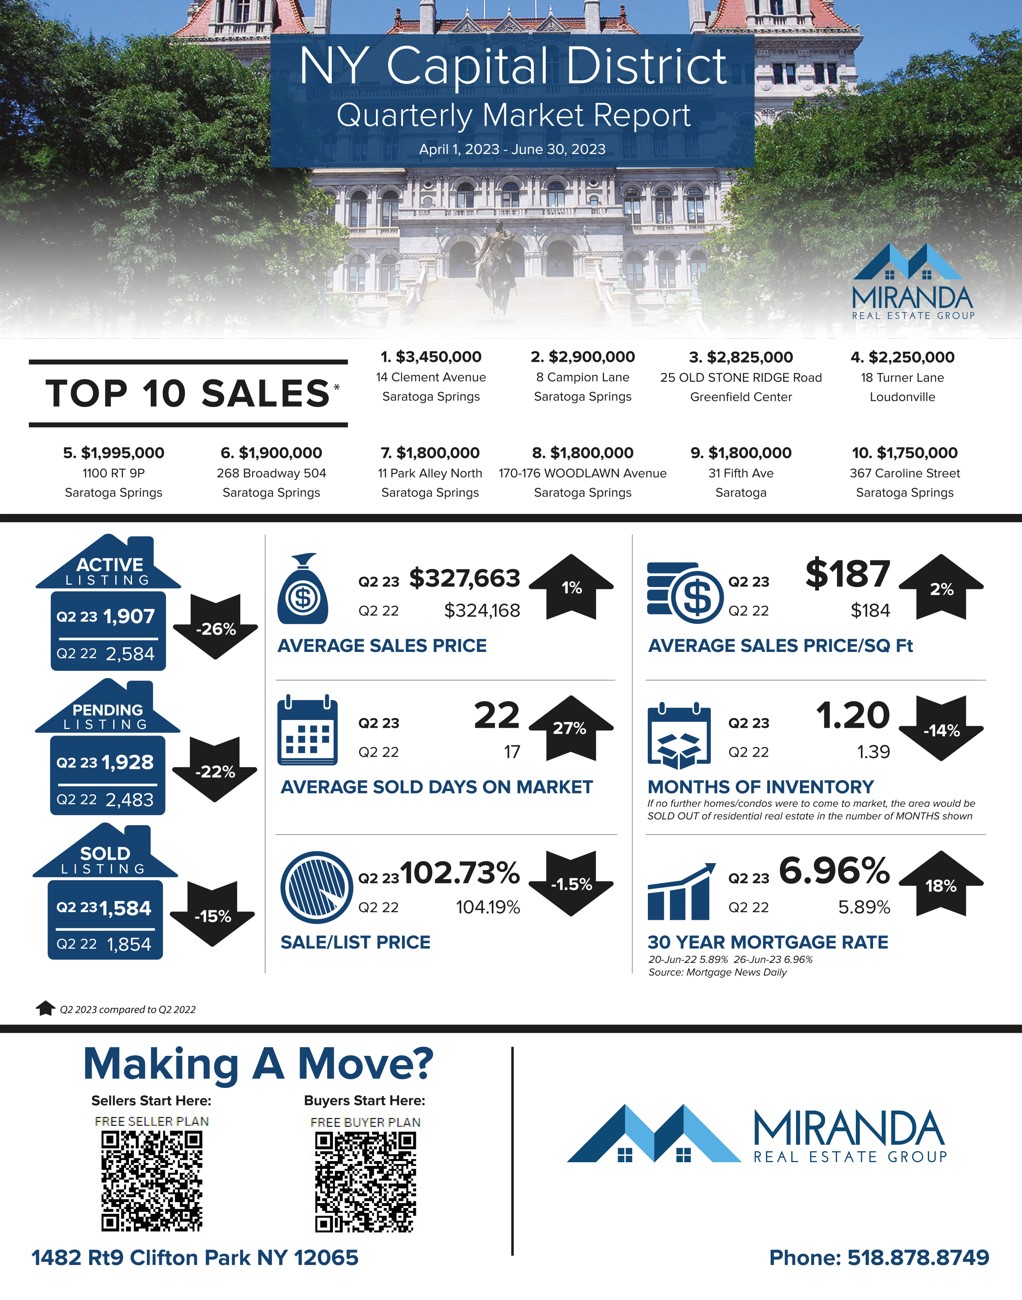
According to data from the Global MLS, the marketplace for NY Capital District residential properties, here are the latest stats (Q2 ’23 VS Q2 ’22):
-The Number of SOLD listings decreased by 22% to 1,928 properties with a top sale of $3.45 million at 14 Clement Ave in Saratoga Springs.
-The Average Sales Price increased 1%, to $327,663.
–Average Price Per Square Foot increased 2% to $187/sq. ft.
-The inventory of properties available for sale as measured in months supply decreased to 1.2 months’ worth of properties for sale.
– Mortgage News Daily shows that the average 30-year fixed mortgage rate increased slightly to 6.96%.
In summary, our market continues to be on fire. Inventory constraints continue to overwhelm the drag that increased interest rates are having out market pricing, with a staggering 63% of homes selling above the asking price.